


In “Do Public Services Actually Reach the Public?”, a new methodology for assessing the allocation of funds and responsibilities to local governments was explored. With this methodology in mind, I set out to put the local public sector (LPS) in developing countries to the test. After careful evaluation, it is clear that a lack of decentralization and transparency can hinder the ability of governments to provide public services to all citizens.
Note: While LPSI focuses on four areas to profile LPS -organization/structure, function, finance, and institutions-the following report utilizes organization and finance most frequently. This is a result of available information and translation.
Overview
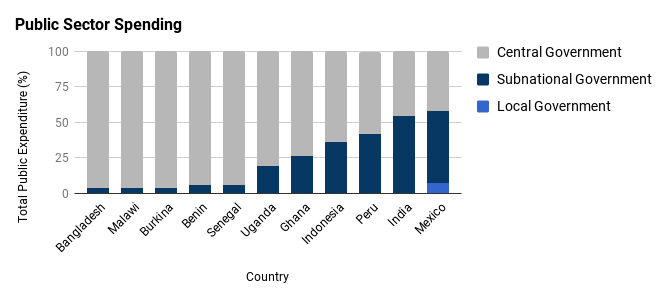
The graphic above depicts a public sector expenditure profile of eleven developing countries. It is clear that central governments are overwhelmingly the source of public sector expenditure, with subnational governments only contributing over 20% of expenditure in five countries. The question then arises; how much of public sector expenditure is spent at the local level?
While some information about subnational spending is available, very little exists at the local government level. Few countries make this information available online to the public. This lack of transparency poses a challenge to assessing the LPS. Of the original eleven countries under consideration, two possessed the level of budget transparency necessary: India and Indonesia.
India
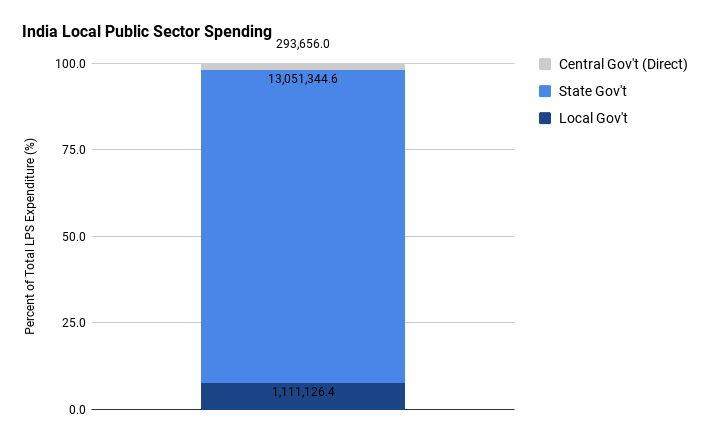
In India, only a small fraction of LPS expenditure comes directly from the central government. While the central government contributes to nearly 50% of the public sector expenditure, only about 2% (shown in grey) is used for direct local public service delivery. A majority of local public services are paid for by state governments, with less than 10% provided by local (rural) governments.
India is known for its commitment to the Open Budget Initiative. However, of the 29 states that comprise India, only nine offered a functional government website, translated budget documents, and/or public access to financial records at the local (rural) level.
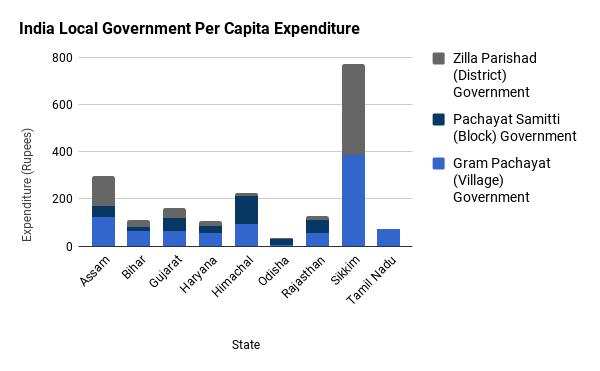
To examine the reach of the LPS in these nine states, panchayat (or rural) government tiers were considered. The results, illustrated by the graph above, demonstrate discrepancies in per capita spending.
At first glance, it appears that village level governments, which are closest to rural communities, largely contribute to LPS expenditure. However, it is evident that densely populated states spend significantly less on public services per person than less densely populated areas. Sikkim accounts for less than 1% of the national population, yet its local government spends 672 rupees more per citizen than in the most densely populated state, Bihar (8%).
Further, the expenditure of local government tiers pales in comparison to the amount spent on the public sector by state governments. At the local level, Sikkim’s per capita expenditure is a little less than 800 rupees. At the state level, per capita expenditure is over 7000 rupees. In the remaining 8 states with local per capita information, the local level per capita expenditure is around 200 rupees, while the state level per capita expenditure is 1000 rupees or more.
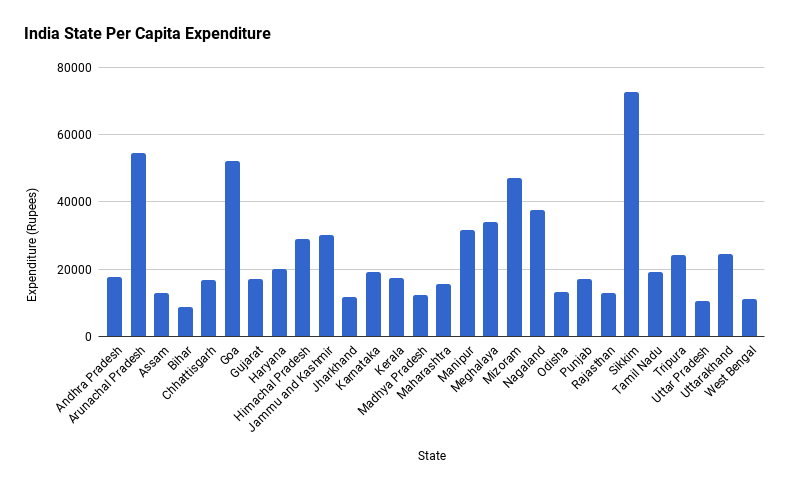
Shown by the graph above, the three states with the highest per capita expenditure, Arunachal Pradesh, Goa, and Sikkim, each comprise less than 1% of the national population. Meanwhile, the three most densely populated states, Bihar (8%), Maharashtra (8.5%), and Uttar Pradesh (15%), represent three of the lowest per capita expenditures.
The lack of decentralized funds and responsibilities is likely a factor that inhibits India’s ability to provide local public services.
Indonesia
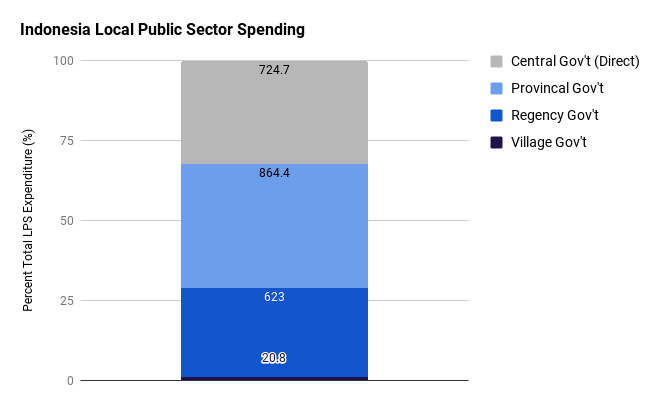
In Indonesia, while subnational LPS expenditure accounts for more than 60% of total LPS spending, only 0.9% comes from village level governments. At nearly 32% of the total LPS expenditure, Indonesia’s central government directly provides more public services than regency and village governments combined. This lack of decentralization poses a challenge to ensuring that these public services actually reach the public.
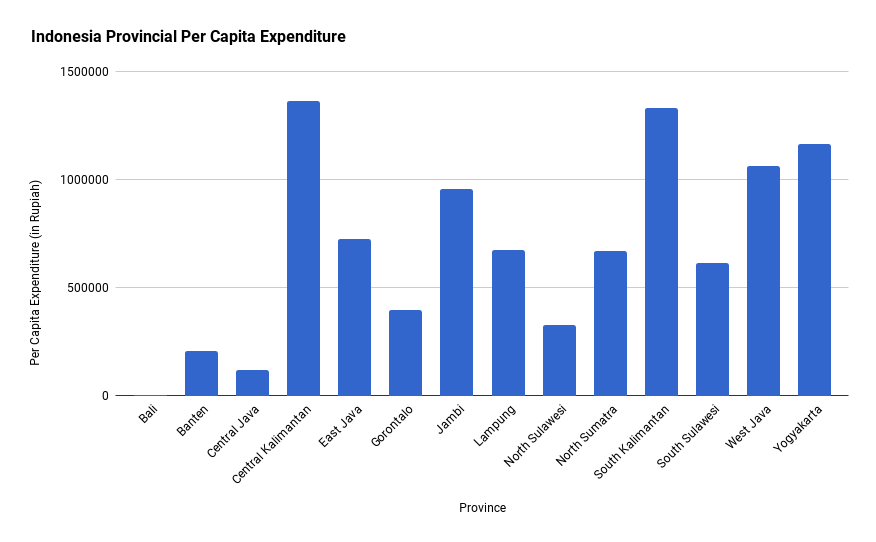
The graph above provides evidence for the effects of largely centralized funds in Indonesia. Central and South Kalimantan, provinces that each account for less than 2% of the total population, spend more per person than the most densely populated provinces, West Java (18%) and East Java (15%). Further, four out of five provinces with the highest per capita expenditure (Central Kalimantan, Jambi, South Kalimantan, and Yogyakarta) comprise only 5% of the national population combined.
Unlike India, local government financial statements are not readily available online in Indonesia. Of the 37 provinces in Indonesia, only 14 offered functioning government websites, translated financial information, and and/or public access to budget documents. Regency and village governments lack their own official websites, and therefore financial statements at these levels are nearly impossible to access. Thus, it is difficult to determine the level that public services actually reach.
Note: Some provincial governments do accept information requests. The public is able to submit a request for information such as budget reports and other official documents. However, access to government portals requires a password in some cases, and there is no guaranteed response time.
Looking Forward
Decentralization is key. If public services are to truly reach the public, then we must empower local governments to provide them. LPS spending by local governments must be increased to ensure that services are provided to even the most rural villages. The World Bank agrees that decentralization is a promising method to improving public service delivery, but institutional arrangements will affect the success of implementation. Accountability, transparency, and access to public information are essential for effective decentralization.
In order to reap the greatest benefits of decentralization, budget transparency must be a priority. Proper record keeping and public access to information will allow citizens to hold their local government accountable. Updated government websites, translation of budget documents, and public access to financial records are essential to ensuring the delivery of public services.
The CLD movement aims to empower communities to be leaders in their own development. Decentralization moves funds and decision-making closer to local communities, essentially giving citizens more of a voice. CLD supporters should encourage transparency and accountability in developing countries to assure that decentralization leads to more efficient local public service delivery.
Featured image courtesy of The Hunger Project
References:
United Cities and Local Governments (UCLG), Organization for Economic Co-Operation and Development (OECD), Agence française de développement (AFD), 2016: “Subnational Governments Around the World: Structure and Finance”
Open Government Data (OGD) Platform India, 2015: “Per capita total expenditure from 2007-08 to 2013-14”
Commonwealth Local Government Forum (CLGF), n.d.: “The local government system in India”
International Monetary Fund Government Finance Statistics (GFS), 2015: “India”
Organization for Economic Co-Operation and Development (OECD), 2016: “India-Federal Country”
Organization for Economic Co-Operation and Development (OECD), 2016: “Indonesia-Unitary Country”
Organization for Economic Co-Operation and Development (OECD), 2016: “OECD Economic Surveys: Indonesia”
Shah, Anwar, 2006: “Local Governance in Developing Countries”
Bank Indonesia, 2015: “Economic Report on Indonesia”
Reserve Bank of India, 2017: “State Finances: A Study of Budgets”
Ministry of Panchayati Raj, 2014: “13th Finance Commission Report”
Government of Himachal Pradesh, 2014: “Report of the Fourth State Finance Commission”
Bora, P.K., Dispur, Guwahati, 2012: “Report of the Fourth Assam State Finance Commission”
Government of Bihar, 2016: “Final Report of the Fifth State Finance Commission”
Government of Gujarat, n.d.: “Statement of Income and Expenditure of District Panchayats of Gujarat From 2006-07 to 2010-11”
Government of Gujarat, n.d.: “Income & Expenditure of all District Panchayats”
Government of Gujarat, n.d.: “Income & Expenditure of all Taluka Panchayats (2012-2013)”
Government of Gujarat, n.d.: “Statement of Income and Expenses of Village Panchayats 2012-13”
Government of Haryana, 2008: “Report of 3rd State Finance Commission”
Panchayati Raj Department, Government of Odisha, n.d.: “Annual Activity Report of Panchayati Raj Department for the Year 2016-17 [Panchayat Samiti]”
Panchayati Raj Department, Government of Odisha, n.d.: “Annual Activity Report of Panchayati Raj Department for the Year 2016-17 [Zilla Parisada]”
Government of Sikkim, 2013: ”Report of the 4th State Finance Commission, Sikkim for the Award period 2015-2020”
Government of Tamil Nadu, n.d.: “Third State Finance Commission-Summary of Recommendations”
Government of Rajasthan, n.d.: ”Rajasthan State Budget 2016-17”
Government of Bali, n.d.: “Public Information Collection”
Government of Banten, 2014: “Reports of Realization of SKPD Budget”
Government of Central Java, 2016: “Report on the Realization of Central Java Provincial Budget Year 2016”
Finance Bureau, Central Kalimantan Provincial Secretariat, n.d.: “Budget Transparency”
Government of East Java, 2015: “Financial Statements”
Government of Gorontalo, n.d.: “Regional Financial Transparency”
Government of Jambi, 2013: “Budget Revenue & Regional Shopping”
Government of Jambi, 2013: “Summary of PPKD Budget Document Implementation (DPA)”
Government of Jambi, n.d.: “Summary of Document Implementation of Budget (DPA) SKPD”
Government of Lampung, n.d.: “Budget Management Transparency 2016”
Government of North Sulawesi, n.d.: “Budget Transparency 2017”
Government of North Sumatra, n.d.: “Budget Utilization”
Government of North Sumatra, n.d.: “List of Public Information of North Sumatra Province”
Government of South Sulawesi, 2013: “Summary of Realization APBD”
Government of South Sulawesi, n.d.: “Document Finance- LRA”
Government of West Java, 2015: “Budget Management Transparency Year 2016”
Government of Yogyakarta, 2015: “Performance Report Year 2014”